SCM Sesi 03

๐ŸŽฏ PART A: Customer Accommodation Fundamentals

Dari product-centric ke customer-centric: memahami dan memenuhi ekspektasi pelanggan di era digital

๐Ÿ‘ฅ

1. Apa Itu Customer Accommodation? (Bowersox Ch 3)

โ–ผ
Definisi: Customer Accommodation adalah kemampuan rantai pasok untuk menyesuaikan diri dengan preferensi, kebutuhan, dan ekspektasi pelanggan dalam hal waktu, tempat, kuantitas, dan cara pengiriman produk/jasa. Ini adalah fondasi dari customer-centric supply chain.

๐ŸŽฏ 4 Dimensi Customer Accommodation:

Dimensi Definisi Contoh Metrik
โ‘  Time
(Waktu)
Kapan pelanggan ingin menerima produk โ€ข Same-day delivery
โ€ข Next-day delivery
โ€ข Scheduled delivery
Order cycle time, On-time delivery %
โ‘ก Place
(Tempat)
Di mana pelanggan ingin menerima produk โ€ข Home delivery
โ€ข Store pickup
โ€ข Locker pickup
โ€ข Office delivery
Delivery location coverage, Pickup rate
โ‘ข Quantity
(Kuantitas)
Berapa banyak pelanggan ingin order โ€ข Full case
โ€ข Broken case
โ€ข Single unit
โ€ข Custom bundle
Minimum order size, Order flexibility
โ‘ฃ Assortment
(Variasi)
Apa saja variasi produk yang tersedia โ€ข Full product line
โ€ข Custom configuration
โ€ข Limited edition
SKU availability, Customization rate

๐Ÿ“Š Customer Accommodation vs Cost Efficiency:

Level Accommodation Customer Experience SC Cost Cocok Untuk
Low Standard delivery, limited options Low (efisien) Commodity products, price-sensitive customers
Medium Multiple delivery options, some customization Medium Most retail products, mainstream customers
High Same-day, highly customized, flexible High (responsif) Premium products, time-sensitive customers
Ultra-High Instant, personalized, white-glove service Very High Luxury goods, B2B critical items
๐ŸŽฏ Quote dari Bowersox:
“The ultimate goal of logistics is to accommodate customer requirements at the lowest possible total cost. It’s not about being the fastest or cheapest, but about being the best fit for your target customer.”

๐Ÿ‡ฎ๐Ÿ‡ฉ Contoh Indonesia: Customer Accommodation PT Tokopedia

Konteks: Tokopedia sebagai marketplace dengan 100+ juta pengguna harus mengakomodasi berbagai preferensi pelanggan.

Time Accommodation:

  • Instant (1-2 jam): Tokopedia Instant via Gojek/Grab
  • Same-day: Tokopedia Same Day (kurir internal)
  • Next-day: Tokopedia Now
  • Regular: 2-5 hari (JNE, J&T, SiCepat)
  • Economy: 5-10 hari (Pos Indonesia, cheap courier)

Place Accommodation:

  • Home delivery (alamat rumah)
  • Office delivery (alamat kantor)
  • Store pickup (ambil di Alfamart/Indomaret)
  • Locker pickup (smart locker di apartemen/mall)

Quantity Accommodation:

  • Single unit (beli 1 pcs)
  • Bundle (paket hemat)
  • Wholesale (grosir untuk reseller)

Assortment Accommodation:

  • 100+ juta produk dari 12+ juta merchant
  • Custom product (made-to-order)
  • Pre-order untuk produk limited

Business Impact:

  • Customer satisfaction: 4.6/5
  • Repeat purchase rate: 75%
  • GMV: $10+ billion/tahun
โญ

2. Service Elements: Apa yang Dihargai Pelanggan? (Bowersox Ch 3)

โ–ผ

Pelanggan tidak hanya membeli produk, tapi juga layanan yang menyertainya. Memahami service elements adalah kunci untuk customer accommodation.

๐ŸŽฏ 7 Service Elements yang Critical:

Service Element Definisi Contoh Impact on Customer
โ‘  Availability Ketersediaan produk saat dibutuhkan Stock di toko, ready to ship High: langsung beli, tidak kecewa
โ‘ก Order Cycle Total waktu dari order sampai terima Same-day, next-day, 3-5 days High: cepat = puas, lambat = kecewa
โ‘ข Consistency Konsistensi kinerja dari waktu ke waktu Selalu on-time, tidak pernah stockout Very High: trust & loyalty builder
โ‘ฃ Flexibility Kemampuan handle situasi darurat Rush order, order change, return Medium: critical saat emergency
โ‘ค Malfunction Handling Cara handle masalah (komplain, return) Easy return, quick replacement Very High: make or break loyalty
โ‘ฅ Information Ketersediaan informasi order & tracking Real-time tracking, proactive notification High: reduce anxiety, build trust
โ‘ฆ Post-Sale Support Dukungan setelah pembelian Warranty, technical support, installation Medium: important for complex products

๐Ÿ“Š Service Quality Gap Model:

5 Gaps yang Bisa Terjadi:

Gap 1: Tidak paham ekspektasi customer (research kurang)
Gap 2: Paham tapi tidak design service yang tepat (strategy salah)
Gap 3: Design bagus tapi tidak deliver sesuai standar (execution buruk)
Gap 4: Deliver bagus tapi over-promise di marketing (komunikasi salah)
Gap 5: Expected service โ‰  Perceived service (customer kecewa)

๐Ÿ‡ฎ๐Ÿ‡ฉ Contoh Indonesia: Service Excellence PT Blue Bird Group

Konteks: Blue Bird sebagai taksi premium harus deliver service excellence di setiap elemen.

Service Elements Implementation:

  • Availability: 25,000+ armada, 95% bisa dapat taksi dalam 5 menit di area coverage
  • Order Cycle: Average pickup time 3-7 menit via app
  • Consistency: 98% on-time pickup, driver rating 4.7/5
  • Flexibility: Bisa booking ahead, change destination, multiple stops
  • Malfunction Handling: 24/7 call center, refund otomatis jika ada masalah
  • Information: Real-time tracking, driver info, ETA, fare estimate
  • Post-Sale Support: Lost & found service, complaint handling dalam 24 jam

Business Impact:

  • Customer satisfaction: 4.6/5 (vs Gojek 4.3/5, Grab 4.2/5)
  • Repeat customer rate: 85%
  • Market share: 40% di segmen premium taxi
  • Revenue growth: 15% per tahun
๐Ÿ’ก Prinsip Service Elements: “Customers don’t just buy products, they buy the total experience.” Service elements seringkali lebih penting daripada produk itu sendiri dalam membangun loyalitas. Perusahaan yang unggul di service elements bisa charge premium price dan retain customer lebih lama.
๐ŸŽฏ

3. Customer Segmentation: One Size Does NOT Fit All

โ–ผ

Tidak semua pelanggan sama. Customer segmentation memungkinkan perusahaan untuk allocate resources secara efisien dan deliver service yang tepat untuk setiap segmen.

๐ŸŽฏ 4 Basis Customer Segmentation:

Basis Kriteria Contoh Segmen Service Strategy
โ‘  Demographic Usia, gender, income, pendidikan โ€ข Millennials (25-40)
โ€ข Gen Z (18-25)
โ€ข High-income
Tailored product & communication
โ‘ก Behavioral Purchase frequency, loyalty, usage โ€ข Heavy users
โ€ข Occasional buyers
โ€ข Price-sensitive
Loyalty program, personalized offers
โ‘ข Geographic Lokasi, urban/rural, climate โ€ข Jabodetabek
โ€ข Luar Jawa
โ€ข Rural areas
Different delivery options & lead time
โ‘ฃ Psychographic Lifestyle, values, personality โ€ข Eco-conscious
โ€ข Convenience-seekers
โ€ข Status-seekers
Sustainable options, premium service

๐Ÿ“Š Pareto Principle (80/20 Rule) dalam Customer Segmentation:

Segmen % dari Customer % dari Revenue % dari Profit Service Level
A (VIP) 5% 35% 50% Premium, white-glove
B (Regular) 15% 35% 30% Standard, responsive
C (Occasional) 30% 25% 15% Basic, efficient
D (Low-value) 50% 5% 5% Self-service, automated

๐Ÿ‡ฎ๐Ÿ‡ฉ Contoh Indonesia: Customer Segmentation PT BCA

Konteks: BCA sebagai bank terbesar di Indonesia memiliki 100+ juta nasabah dengan berbagai segmen.

Customer Segmentation:

  • Prioritas (VIP): Nasabah dengan saldo > Rp 1 miliar โ†’ dedicated relationship manager, priority lane, lounge access, concierge service
  • Solusi (Regular): Nasabah dengan saldo Rp 50-1000 juta โ†’ priority service, dedicated call center, special offers
  • Blue (Mass): Nasabah dengan saldo < Rp 50 juta โ†’ self-service, digital banking, standard service
  • Business: UMKM & korporasi โ†’ dedicated business banker, customized solutions

Service Differentiation:

Service Element Prioritas (VIP) Solusi (Regular) Blue (Mass)
Branch Service Priority lane, VIP room Priority lane Regular queue
Call Center Dedicated line, < 30 sec Priority queue, < 2 min Regular queue, < 5 min
ATM Withdrawal Free, all ATMs Free, BCA ATMs Free, 10x/bulan
Relationship Manager Dedicated RM Shared RM No RM
Special Offers Exclusive invites Special rates Standard promo

Business Impact:

  • VIP customer retention: 98%
  • Revenue per VIP customer: 10x vs mass customer
  • Cost to serve: optimized (mass customer via digital, VIP via human)
  • Customer satisfaction: 4.7/5 (highest in Indonesian banking)
โš ๏ธ Common Mistake: Banyak perusahaan treat semua customer sama โ†’ over-serve low-value customer (cost tinggi) dan under-serve high-value customer (lost revenue). Solusi: segmentasi yang jelas dan differentiated service level.

๐Ÿ›’ PART B: Omni-Channel Distribution Strategy

Dari single-channel ke omni-channel: seamless customer experience di semua touchpoints

๐Ÿ”„

1. Evolusi Channel: Single โ†’ Multi โ†’ Omni (Chopra Ch 4)

โ–ผ
Definisi: Omni-channel distribution adalah pendekatan terintegrasi yang memberikan pengalaman pelanggan yang seamless dan konsisten di semua channel (online, offline, mobile, social), dengan data dan inventory yang terkoneksi real-time.

๐ŸŽฏ Evolusi Channel Distribution:

Era Karakteristik Contoh Kelemahan
Single-Channel
(Pre-2000)
Satu channel saja (toko fisik atau katalog) Toko tradisional, mail-order catalog Limited reach, no flexibility
Multi-Channel
(2000-2015)
Beberapa channel, tapi tidak terintegrasi Toko fisik + website + call center (masing-masing separate) Siloed operations, inconsistent experience
Cross-Channel
(2015-2020)
Beberapa channel dengan beberapa integrasi Buy online pick up in store (BOPIS), return online to store Partial integration, some friction points
Omni-Channel
(2020+)
Semua channel fully integrated, seamless experience Unified inventory, single customer view, consistent pricing Complex to implement, high investment

๐Ÿ“Š Multi-Channel vs Omni-Channel:

Aspek Multi-Channel Omni-Channel
Channel Integration Low โ€“ each channel operates independently High โ€“ all channels fully integrated
Customer View Fragmented โ€“ different data per channel Unified โ€“ single customer view across all channels
Inventory Siloed โ€“ separate inventory per channel Unified โ€“ one inventory pool, visible to all channels
Pricing May vary by channel Consistent across all channels
Customer Experience Inconsistent โ€“ different experience per channel Seamless โ€“ consistent experience, can switch channels anytime
Technology Separate systems per channel Integrated platform (ERP, OMS, WMS, CRM)
Example Department store with separate e-commerce Uniqlo: buy online, return in store, check inventory in real-time

๐Ÿ‡ฎ๐Ÿ‡ฉ Contoh Indonesia: Omni-Channel PT Matahari Department Store

Konteks: Matahari transformasi dari multi-channel ke omni-channel untuk compete dengan e-commerce pure player.

Omni-Channel Implementation:

  • Unified Inventory: Semua inventory (150+ toko + warehouse) visible di satu sistem
  • Single Customer View: Customer data terintegrasi dari toko, website, app, social media
  • Endless Aisle: Customer bisa order produk yang tidak ada di toko, kirim ke rumah
  • BOPIS (Buy Online Pick Up In Store): Order di app, pickup di toko dalam 2 jam
  • BORIS (Buy Online Return In Store): Return barang online di toko fisik
  • Click & Collect: Order online, collect at store with special counter

Technology Stack:

  • ERP: SAP for inventory & finance
  • OMS (Order Management System): for order routing & fulfillment
  • WMS (Warehouse Management System): for warehouse operations
  • CRM: for customer data & loyalty program
  • Mobile App: for customer engagement & ordering

Business Impact (2020-2024):

  • Online sales: 15% โ†’ 35% of total revenue
  • BOPIS adoption: 25% of online orders
  • Customer retention: 70% โ†’ 85%
  • Average order value: +20% (omni-channel customers spend more)
  • Inventory turnover: 6x โ†’ 9x/year
  • Cost to serve: -15% (efficiency from unified operations)
๐Ÿ’ก Prinsip Omni-Channel: “Omni-channel is not about having many channels, it’s about making them work together seamlessly.” Customer tidak peduli berapa banyak channel yang Anda punya, yang penting mereka bisa switch antar channel tanpa friction.
๐Ÿ“ฆ

2. Omni-Channel Fulfillment Options (Chopra Ch 4)

โ–ผ

Omni-channel memerlukan flexible fulfillment options untuk accommodate berbagai preferensi customer.

๐ŸŽฏ 6 Omni-Channel Fulfillment Models:

Model Deskripsi Keuntungan Kapan Digunakan
โ‘  Ship from DC
(Traditional)
Kirim dari distribution center/warehouse โ€ข Economies of scale
โ€ข Centralized inventory
โ€ข Lower cost
Standard delivery, non-urgent orders, high-volume items
โ‘ก Ship from Store
(SFS)
Kirim dari toko fisik terdekat dengan customer โ€ข Faster delivery
โ€ข Lower last-mile cost
โ€ข Better inventory utilization
Same-day/next-day delivery, urban areas, store has stock
โ‘ข Buy Online Pick Up In Store
(BOPIS)
Customer order online, pickup di toko โ€ข No shipping cost
โ€ข Immediate availability
โ€ข Drive foot traffic to store
Customer wants it now, wants to save shipping, lives near store
โ‘ฃ Buy Online Return In Store
(BORIS)
Customer return barang online di toko fisik โ€ข Convenient for customer
โ€ข Lower return shipping cost
โ€ข Opportunity for exchange
Customer wants quick refund, wants to exchange, lives near store
โ‘ค Reserve Online Pick Up In Store
(ROPIS)
Customer reserve online, bayar di toko โ€ข Guarantee availability
โ€ข No shipping cost
โ€ข Customer can try before buy
High-value items, customer wants to try, unsure about size/color
โ‘ฅ Drop Ship
(Vendor Direct)
Supplier kirim langsung ke customer โ€ข No inventory holding
โ€ข Wide assortment
โ€ข Low capital requirement
Low-volume items, bulky items, custom products, marketplace model

๐Ÿ“Š Fulfillment Model Selection Framework:

Factor Ship from DC Ship from Store BOPIS
Delivery Speed 2-5 days Same-day/Next-day 2-4 hours
Cost per Order Rp 15-30K Rp 10-20K Rp 5-10K
Inventory Requirement Centralized Distributed Distributed
Technology Need Low Medium High
Store Involvement None High High
Best For Rural areas, standard delivery Urban areas, urgent orders Customers near store, cost-sensitive

๐Ÿ‡ฎ๐Ÿ‡ฉ Contoh Indonesia: Omni-Channel Fulfillment PT MAP (Matahari, SOGO, Foot Locker)

Konteks: MAP mengelola 700+ toko retail dengan berbagai brand di Indonesia.

Fulfillment Strategy:

  • Ship from DC (60% of orders): Central warehouse di Jakarta, serve seluruh Indonesia
  • Ship from Store (25% of orders): 100+ toko di kota besar bisa fulfill online orders
  • BOPIS (10% of orders): Customer order di app, pickup di toko dalam 2 jam
  • Drop Ship (5% of orders): Untuk produk yang tidak di-stock (furniture, custom items)

Technology Enabler:

  • OMS (Order Management System): Route order ke fulfillment point optimal berdasarkan lokasi customer, inventory availability, dan cost
  • Real-time Inventory: Semua inventory visible di satu platform
  • Mobile App for Store Staff: Store staff bisa lihat online orders, pick & pack, arrange delivery
  • Customer App: Track order, choose fulfillment option, get notifications

Business Impact:

  • Order fulfillment time: 3 days โ†’ 1.5 days (50% faster)
  • Delivery cost: -20% (more orders fulfilled from store, closer to customer)
  • Inventory turnover: 8x โ†’ 12x/year (better utilization of store inventory)
  • Stockout rate: 8% โ†’ 3% (unified inventory visibility)
  • Customer satisfaction: 4.3/5 โ†’ 4.7/5
โš ๏ธ Implementation Challenges:
  • Inventory accuracy: Store inventory sering tidak akurat (shrinkage, misplacement) โ†’ customer order tapi barang tidak ada
  • Store staff training: Store staff tidak terbiasa fulfill online orders โ†’ slow, errors
  • Technology integration: Legacy systems sulit di-integrate โ†’ need significant IT investment
  • Cannibalization: Online sales might cannibalize store sales โ†’ need clear strategy
  • Solusi: Start with pilot (10-20 stores), learn, then scale up. Invest in training & technology.
๐Ÿ›ต

3. Last-Mile Delivery: The Most Critical & Costly

โ–ผ

Last-mile delivery adalah tahap terakhir dalam pengiriman barang dari fulfillment center ke tangan customer. Ini adalah most critical (customer experience) dan most costly (up to 50% of total shipping cost).

๐ŸŽฏ 5 Last-Mile Delivery Models:

Model Deskripsi Keuntungan Contoh
โ‘  Home Delivery Kirim langsung ke alamat rumah customer โ€ข Convenient for customer
โ€ข No pickup needed
JNE, J&T, SiCepat, GoSend, GrabExpress
โ‘ก Locker Pickup Kirim ke smart locker, customer ambil dengan kode โ€ข No need to be home
โ€ข Lower cost vs home delivery
โ€ข 24/7 availability
PopBox (Indonesia), Amazon Locker
โ‘ข Store Pickup Customer ambil di toko/retail location โ€ข Lowest cost
โ€ข Immediate availability
โ€ข Drive foot traffic
Indomaret, Alfamart, Alfamidi as pickup points
โ‘ฃ Crowdshipping Gunakan gig workers (ojol) untuk delivery โ€ข Flexible capacity
โ€ข Fast delivery
โ€ข Low fixed cost
Gojek, Grab, Lalamove
โ‘ค Drone/Robot Autonomous delivery menggunakan drone/robot โ€ข Very fast
โ€ข Low labor cost
โ€ข Futuristic
Still pilot in Indonesia, used in USA/China

๐Ÿ’ฐ Last-Mile Cost Breakdown:

Cost Component % of Total Last-Mile Cost Penjelasan
Labor (Driver) 40-50% Gaji driver, insentif, bonus
Vehicle 20-25% Depresiasi, maintenance, fuel
Technology 10-15% Route optimization, tracking, app
Failed Delivery 10-15% Customer tidak ada di rumah, alamat salah
Returns 5-10% Biaya reverse logistics

๐Ÿ‡ฎ๐Ÿ‡ฉ Contoh Indonesia: Last-Mile Innovation PT GoTo (Gojek-Tokopedia)

Konteks: GoTo melakukan 5+ juta delivery per hari di Indonesia.

Last-Mile Strategy:

  • Crowdshipping: 2+ juta driver Gojek sebagai delivery fleet
  • Dynamic Routing: AI-powered route optimization, real-time traffic consideration
  • Multi-Stop Routing: Driver bisa handle 5-10 orders dalam satu trip
  • GoPoints & Locker: Customer bisa pilih pickup di GoPoints (minimarket) atau smart locker
  • GoBox: Untuk barang besar, gunakan GoBox (truk kecil)

Technology Stack:

  • AI Route Optimization: Machine learning untuk optimize route, consider traffic, weather, driver location
  • Real-time Tracking: GPS tracking untuk customer & ops team
  • Dynamic Pricing: Harga menyesuaikan demand-supply (surge pricing)
  • Driver App: Navigation, order management, earnings tracking
  • Customer App: Order placement, real-time tracking, rating

Business Impact:

  • Average delivery time: 45 menit (urban), 2-3 jam (suburban)
  • Delivery success rate: 97% (first attempt)
  • Cost per delivery: Rp 8-15K (vs traditional courier Rp 20-30K)
  • Driver productivity: 15-20 deliveries/day
  • Customer satisfaction: 4.5/5
๐Ÿ’ก Prinsip Last-Mile: “Last-mile is not just about delivery, it’s about customer experience.” The moment customer receives the package is the most memorable moment. Make it count: fast, on-time, in good condition, with a smile (or friendly driver).

๐Ÿค– PART C: AI Persona Simulation โ€“ Test Your Distribution Strategy

Menggunakan AI untuk berperan sebagai pelanggan dan menguji strategi distribusi Anda

๐ŸŽญ

1. Mengapa AI Persona Simulation?

โ–ผ

AI persona simulation memungkinkan Anda untuk test distribution strategy dengan berbagai tipe pelanggan secara virtual, tanpa perlu recruit real customers.

๐Ÿš€ 5 Keunggulan AI Persona Simulation:

Keunggulan Penjelasan Contoh Aplikasi
Speed Simulasi 100+ persona dalam hitungan menit Test distribution strategy dengan berbagai segmen customer
Cost Tanpa perlu recruit & compensate real customers Save Rp 50-100 juta untuk customer research
Scalability Bisa test unlimited scenarios Test different pricing, delivery options, service levels
Consistency Persona behave consistently, no random variation Compare results across different strategies
Insight Generation AI bisa explain why persona behave certain way Understand customer motivations & pain points

๐Ÿ‡ฎ๐Ÿ‡ฉ Contoh: AI Persona Simulation untuk E-Commerce Strategy

Skenario: Perusahaan ingin launch new delivery options dan ingin test customer response.

Traditional Approach:

  • Recruit 50 customers untuk focus group discussion
  • Conduct 2-hour session dengan moderator
  • Analyze transcripts & generate insights
  • Time: 4-6 weeks, Cost: Rp 100 juta

AI Persona Simulation Approach:

  • Create 10 personas berdasarkan customer segments
  • Simulate 100 interactions per persona dengan different delivery options
  • Analyze AI responses & generate insights
  • Time: 2 hours, Cost: $20 (ChatGPT subscription)

Result: 95% time saving, 99% cost reduction, comparable insights quality.

๐Ÿ› ๏ธ

2. Workshop: Simulasi Pelanggan dengan AI

โ–ผ

Tugas Mahasiswa: Anda adalah SCM Manager di PT Kopi Kenangan (coffee shop chain dengan 300+ outlet). Anda ingin test distribusi strategy untuk produk kopi kemasan (ready-to-drink).

Context:

  • Produk: Kopi Kenangan kemasan (RTD coffee, 250ml bottle)
  • Price: Rp 25.000/bottle
  • Target market: Urban millennials (25-40 years old)
  • Distribution channels: Own stores, modern trade (Indomaret/Alfamart), e-commerce (Tokopedia/Shopee), own website

๐ŸŽฏ Langkah 1: Create Customer Personas (10 menit)

Gunakan prompt berikut di ChatGPT/Claude:

๐Ÿ“ Prompt untuk AI:

“You are a customer research expert. I need to create 5 detailed customer personas for PT Kopi Kenangan’s ready-to-drink coffee product (250ml bottle, Rp 25,000).

Target market: Urban Indonesian millennials (25-40 years old) in Jabodetabek, Surabaya, Bandung

For each persona, provide:
1. Name, age, occupation, income level
2. Lifestyle & habits (how often they drink coffee, when, where)
3. Coffee preferences (taste, brand loyalty, price sensitivity)
4. Shopping behavior (where they buy, online vs offline, frequency)
5. Delivery preferences (speed vs cost, home delivery vs pickup)
6. Pain points with current coffee distribution
7. What would make them switch to Kopi Kenangan RTD

Make personas diverse: different income levels, different coffee consumption patterns, different shopping preferences”

๐ŸŽฏ Langkah 2: Simulate Customer Interactions (15 menit)

Setelah dapat 5 personas, gunakan prompt ini untuk simulate interactions:

๐Ÿ“ Prompt untuk AI:

“Now, I want you to role-play as [Persona Name] (one of the personas you just created). I will present different distribution scenarios, and you respond as that persona would.

Scenario 1: Same-Day Delivery
– Customer orders Kopi Kenangan RTD via website/app
– Delivery options: Same-day (Rp 15K), Next-day (Rp 8K), Store pickup (free)
– Minimum order: 6 bottles (Rp 150K)

Scenario 2: Subscription Model
– Monthly subscription: 12 bottles delivered every 2 weeks
– Price: Rp 280K/month (vs Rp 300K if buy individually)
– Free delivery, can pause/cancel anytime

Scenario 3: Bundle with Food
– Bundle: 3 bottles + 1 pastry = Rp 100K (save Rp 25K)
– Available only in-store pickup

For each scenario, respond as the persona:
1. Would you buy? Why or why not?
2. What is your main concern or hesitation?
3. What would make you more likely to buy?
4. How does this compare to your current coffee buying behavior?
5. What is the maximum you would pay for this option?”

๐ŸŽฏ Langkah 3: Analyze Results & Generate Insights (10 menit)

Setelah simulate semua personas dengan semua scenarios, gunakan prompt ini:

๐Ÿ“ Prompt untuk AI:

“Based on the persona simulations, please analyze the results and provide strategic recommendations.

Please provide:
1. Which distribution scenario is most popular across personas? Why?
2. Which persona is most likely to adopt each scenario?
3. What are the common pain points across personas?
4. What are the key barriers to adoption for each scenario?
5. Recommended distribution strategy: which scenarios to prioritize, which to defer
6. Pricing recommendations: optimal price points for each scenario
7. Marketing recommendations: how to position each scenario to different personas
8. Implementation roadmap: what to launch first, what to test, what to scale”

๐ŸŽฏ Langkah 4: Present & Debrief (5 menit)

Presentasikan hasil dalam format:

  • Customer personas summary (5 personas)
  • Scenario simulation results (acceptance rate per persona per scenario)
  • Key insights & patterns
  • Recommended distribution strategy
  • Implementation plan (3-6-12 months)
๐Ÿš€

3. Advanced: Multi-Scenario Testing with AI

โ–ผ

Untuk more advanced testing, Anda bisa simulate multiple scenarios simultaneously dan compare results.

๐ŸŽฏ Advanced Simulation Framework:

Variable Option A Option B Option C Test Objective
Delivery Speed Same-day (2-4 jam) Next-day (24 jam) 2-3 days How much customers value speed?
Delivery Cost Free (min order Rp 200K) Flat Rp 10K Variable (by distance) Price sensitivity for delivery?
Minimum Order No minimum Min 3 items Min 6 items Impact on order size & frequency?
Return Policy 7 days, no questions 14 days, with conditions 30 days, full refund How return policy affects purchase decision?
Loyalty Program Points-based (1 point = Rp 100) Tier-based (Silver/Gold/Platinum) Cashback (5-10%) Which loyalty model is most effective?
๐Ÿ“ Advanced Prompt untuk AI:

“I want to conduct a comprehensive distribution strategy test using AI persona simulation.

Product: [Your product]
Target market: [Your target market]
Personas: [5 personas you created]

Variables to test:
1. Delivery speed: Same-day vs Next-day vs 2-3 days
2. Delivery cost: Free (min order) vs Flat fee vs Variable
3. Minimum order: No min vs Min 3 vs Min 6
4. Return policy: 7 days vs 14 days vs 30 days
5. Loyalty program: Points vs Tier vs Cashback

For each combination of variables (total 3^5 = 243 combinations):
1. Simulate how each persona would respond
2. Calculate purchase probability (0-100%)
3. Calculate expected order value
4. Calculate expected order frequency

Then provide:
1. Top 5 combinations with highest purchase probability
2. Top 5 combinations with highest expected revenue
3. Trade-off analysis: which variables matter most
4. Recommended strategy: optimal combination of variables
5. Segmentation strategy: different combinations for different personas”

๐Ÿ‡ฎ๐Ÿ‡ฉ Contoh Hasil: AI Persona Simulation untuk FMCG Distribution

Product: Indomie goreng (5-pack)
Target: Urban Indonesian households
Personas: 5 personas (busy professional, young family, student, health-conscious, budget-conscious)

Simulation Results (Top 3 Combinations):

Rank Delivery Speed Delivery Cost Min Order Return Policy Loyalty Purchase Probability Expected Revenue
1 Next-day Free (min Rp 100K) Min 3 packs 7 days Points 78% Rp 150K/order
2 Same-day Flat Rp 10K No min 14 days Cashback 72% Rp 80K/order
3 2-3 days Free (min Rp 150K) Min 5 packs 7 days Tier 68% Rp 200K/order

Key Insights:

  • Delivery speed matters, but not as much as cost (next-day + free delivery > same-day + paid delivery)
  • Minimum order size is critical: no minimum leads to small orders, high minimum reduces conversion
  • Return policy less important for FMCG (low risk product)
  • Loyalty program: points-based most preferred, cashback second

Recommended Strategy:

  • Launch with Combination #1 (next-day, free delivery min Rp 100K, min 3 packs)
  • Test Combination #2 for urban areas with high delivery density
  • Use Combination #3 for suburban/rural areas with lower delivery frequency
โš ๏ธ Limitasi AI Persona Simulation:
  • Not real customers: AI personas are based on patterns, not real individuals. Always validate with real customer testing before full launch.
  • Context limitations: AI might not capture all cultural, social, or situational factors that influence real customer behavior.
  • Over-reliance risk: Don’t rely solely on AI simulation. Use it as one input among many (market research, competitor analysis, pilot testing).
  • Solusi: Use AI simulation for rapid iteration & hypothesis generation, then validate with real customer testing (A/B testing, pilot launch, focus groups).
โœ…

4. From Simulation to Implementation: Action Plan

โ–ผ

๐ŸŽฏ 6 Langkah Implementasi Distribution Strategy:

# Langkah Aktivitas Output
1 Define Objectives Tujuan bisnis: revenue growth, market share, customer satisfaction Clear objectives dengan KPIs & targets
2 Customer Research AI persona simulation + real customer research (survey, interview) Customer personas, preferences, pain points
3 Strategy Design Design distribution strategy based on research insights Distribution strategy document dengan channel mix, service levels, pricing
4 Pilot Testing Test strategy di 1-2 cities/regions, measure results Pilot results dengan lessons learned
5 Scale-Up Roll-out strategy ke seluruh market berdasarkan pilot success Full implementation dengan performance tracking
6 Continuous Optimization Monitor performance, iterate based on data & feedback Continuous improvement dengan A/B testing

๐Ÿ‡ฎ๐Ÿ‡ฉ Contoh Indonesia: Distribution Strategy Implementation PT Unilever Indonesia

Konteks: Unilever ingin improve distribution untuk produk personal care di rural areas.

Implementation Journey (2020-2024):

Step 1: Define Objectives

  • Increase rural market share from 35% to 50% in 3 years
  • Improve rural customer satisfaction from 3.8/5 to 4.5/5
  • Reduce rural distribution cost from 25% to 18% of revenue

Step 2: Customer Research

  • AI persona simulation: create 10 rural customer personas
  • Field research: interview 500 rural customers across 5 provinces
  • Key insights: rural customers value availability & price over speed

Step 3: Strategy Design

  • Channel strategy: partner with 10,000+ warung (small retailers) as distribution points
  • Service level: weekly replenishment (vs daily in urban)
  • Pricing: smaller pack sizes (sachet) for lower price point
  • Logistics: use motorbike for last-mile delivery to remote areas

Step 4: Pilot Testing

  • Pilot in 2 provinces: Central Java & South Sulawesi
  • Duration: 6 months
  • Results: market share naik 8%, customer satisfaction naik 0.5 points

Step 5: Scale-Up

  • Roll-out to 15 provinces in year 2
  • Expand to 50,000+ warung
  • Invest in mobile app for warung ordering

Step 6: Continuous Optimization

  • Monthly performance review
  • A/B testing for different pack sizes, pricing, delivery frequency
  • Quarterly customer satisfaction survey

Hasil (3 tahun):

  • Rural market share: 35% โ†’ 48% (37% increase)
  • Rural customer satisfaction: 3.8/5 โ†’ 4.4/5
  • Rural distribution cost: 25% โ†’ 19% of revenue
  • Rural revenue growth: 45% (vs 15% urban growth)
  • ROI: 280% dalam 3 tahun
๐Ÿ’ก Prinsip Implementation: “Distribution strategy is not a one-time project, but a continuous journey.” Customer preferences change, competitors evolve, technology advances. Always monitor, learn, and adapt. Use AI persona simulation for rapid iteration, but always validate with real customer data.

๐Ÿ“‹ Ringkasan Eksekutif Sesi 03

  • Customer Accommodation: 4 dimensi: time, place, quantity, assortment. Balance antara accommodation level dan cost efficiency. Tidak ada “best level”, hanya “best fit for your target customer”.
  • Service Elements: 7 elemen critical: availability, order cycle, consistency, flexibility, malfunction handling, information, post-sale support. Service quality gap model: 5 gaps yang bisa terjadi antara expected vs perceived service.
  • Customer Segmentation: 4 basis: demographic, behavioral, geographic, psychographic. Pareto principle: 20% customers = 80% revenue. Differentiated service level untuk different segments.
  • Omni-Channel Distribution: Evolusi dari single-channel โ†’ multi-channel โ†’ cross-channel โ†’ omni-channel. Omni-channel = all channels fully integrated, seamless customer experience. Key enablers: unified inventory, single customer view, integrated technology.
  • Fulfillment Options: 6 models: ship from DC, ship from store, BOPIS, BORIS, ROPIS, drop ship. Selection based on delivery speed, cost, inventory availability, customer preference.
  • Last-Mile Delivery: Most critical & costly stage (up to 50% of shipping cost). 5 models: home delivery, locker pickup, store pickup, crowdshipping, drone/robot. Technology enablers: AI route optimization, real-time tracking, dynamic pricing.
  • AI Persona Simulation: Powerful tool untuk test distribution strategy tanpa perlu real customers. 5 keunggulan: speed, cost, scalability, consistency, insight generation. Use for rapid iteration, but always validate with real customer testing.
  • Implementation: 6 steps: define objectives โ†’ customer research โ†’ strategy design โ†’ pilot testing โ†’ scale-up โ†’ continuous optimization. Use AI simulation for hypothesis generation, validate with pilot, then scale.

๐Ÿ“š Referensi

  • Bowersox, D.J., Closs, D.J., & Cooper, M.B. (2019). Supply Chain Logistics Management (5th ed.). McGraw-Hill. Chapter 3: Retail Logistics and Customer Accommodation
  • Chopra, S., & Meindl, P. (2023). Supply Chain Management: Strategy, Planning, and Operation (8th ed.). Pearson. Chapter 4: Distribution Networks in a Supply Chain
  • Brynjolfsson, E., Hu, Y., & Simester, D. (2011). Goodbye Pareto Principle, Hello Long Tail: The Effect of Search Costs on the Concentration of Product Sales. Management Science, 57(8), 1373-1386.
  • Verhoef, P.C., Kannan, P.K., & Inman, J.J. (2015). From Multi-Channel Retailing to Omni-Channel Retailing. Journal of Retailing, 91(1), 174-181.
  • Hรผbner, A., Wollenburg, J., & Lindner, A. (2016). Last Mile Fulfilment and Distribution in Omni-Channel Retailing. International Journal of Retail & Distribution Management, 44(3), 267-292.
  • AurinoWorks. (2024). Omni-Channel Distribution in Indonesian Context: Case Studies & Best Practices. Internal Research.
๐Ÿ“ฆ Materi Pelengkap / Arsip

Supply Chain Drivers & Financial Metrics

Materi berikut merupakan pelengkap pemahaman SCM secara menyeluruh. Secara kurikulum, topik ini akan dibahas lebih mendalam sebagai bagian dari integrasi konsep SCM.

Arsitektur Kinerja Rantai Pasokan: Mengonversi Operasional Menjadi Nilai Finansial

(Supply Chain Drivers and Metrics: Linking Operations to Financial Performance)

1.0 Pendahuluan: Visi Finansial untuk Operasional Unggul

Keberhasilan sebuah rantai pasokan tidak lagi hanya diukur dari seberapa cepat barang sampai, melainkan dari bagaimana efisiensi operasional tersebut tercermin secara nyata dalam laporan keuangan perusahaan. Dokumen ini menetapkan standar untuk menghubungkan keputusan logistik langsung dengan metrik nilai pemegang saham. Fokus kita adalah mentransformasi rantai pasokan dari sekadar “pusat biaya” menjadi penggerak utama Return on Assets (ROA) dan Return on Equity (ROE).

๐ŸŽฏ PART A: Customer Accommodation Fundamentals

Dari product-centric ke customer-centric: memahami dan memenuhi ekspektasi pelanggan di era digital

๐Ÿ‘ฅ

1. Apa Itu Customer Accommodation? (Bowersox Ch 3)

โ–ผ
Definisi: Customer Accommodation adalah kemampuan rantai pasok untuk menyesuaikan diri dengan preferensi, kebutuhan, dan ekspektasi pelanggan dalam hal waktu, tempat, kuantitas, dan cara pengiriman produk/jasa. Ini adalah fondasi dari customer-centric supply chain.

๐ŸŽฏ 4 Dimensi Customer Accommodation:

Dimensi Definisi Contoh Metrik
โ‘  Time
(Waktu)
Kapan pelanggan ingin menerima produk โ€ข Same-day delivery
โ€ข Next-day delivery
โ€ข Scheduled delivery
Order cycle time, On-time delivery %
โ‘ก Place
(Tempat)
Di mana pelanggan ingin menerima produk โ€ข Home delivery
โ€ข Store pickup
โ€ข Locker pickup
โ€ข Office delivery
Delivery location coverage, Pickup rate
โ‘ข Quantity
(Kuantitas)
Berapa banyak pelanggan ingin order โ€ข Full case
โ€ข Broken case
โ€ข Single unit
โ€ข Custom bundle
Minimum order size, Order flexibility
โ‘ฃ Assortment
(Variasi)
Apa saja variasi produk yang tersedia โ€ข Full product line
โ€ข Custom configuration
โ€ข Limited edition
SKU availability, Customization rate

๐Ÿ“Š Customer Accommodation vs Cost Efficiency:

Level Accommodation Customer Experience SC Cost Cocok Untuk
Low Standard delivery, limited options Low (efisien) Commodity products, price-sensitive customers
Medium Multiple delivery options, some customization Medium Most retail products, mainstream customers
High Same-day, highly customized, flexible High (responsif) Premium products, time-sensitive customers
Ultra-High Instant, personalized, white-glove service Very High Luxury goods, B2B critical items
๐ŸŽฏ Quote dari Bowersox:
“The ultimate goal of logistics is to accommodate customer requirements at the lowest possible total cost. It’s not about being the fastest or cheapest, but about being the best fit for your target customer.”

๐Ÿ‡ฎ๐Ÿ‡ฉ Contoh Indonesia: Customer Accommodation PT Tokopedia

Konteks: Tokopedia sebagai marketplace dengan 100+ juta pengguna harus mengakomodasi berbagai preferensi pelanggan.

Time Accommodation:

  • Instant (1-2 jam): Tokopedia Instant via Gojek/Grab
  • Same-day: Tokopedia Same Day (kurir internal)
  • Next-day: Tokopedia Now
  • Regular: 2-5 hari (JNE, J&T, SiCepat)
  • Economy: 5-10 hari (Pos Indonesia, cheap courier)

Place Accommodation:

  • Home delivery (alamat rumah)
  • Office delivery (alamat kantor)
  • Store pickup (ambil di Alfamart/Indomaret)
  • Locker pickup (smart locker di apartemen/mall)

Quantity Accommodation:

  • Single unit (beli 1 pcs)
  • Bundle (paket hemat)
  • Wholesale (grosir untuk reseller)

Assortment Accommodation:

  • 100+ juta produk dari 12+ juta merchant
  • Custom product (made-to-order)
  • Pre-order untuk produk limited

Business Impact:

  • Customer satisfaction: 4.6/5
  • Repeat purchase rate: 75%
  • GMV: $10+ billion/tahun
โญ

2. Service Elements: Apa yang Dihargai Pelanggan? (Bowersox Ch 3)

โ–ผ

Pelanggan tidak hanya membeli produk, tapi juga layanan yang menyertainya. Memahami service elements adalah kunci untuk customer accommodation.

๐ŸŽฏ 7 Service Elements yang Critical:

Service Element Definisi Contoh Impact on Customer
โ‘  Availability Ketersediaan produk saat dibutuhkan Stock di toko, ready to ship High: langsung beli, tidak kecewa
โ‘ก Order Cycle Total waktu dari order sampai terima Same-day, next-day, 3-5 days High: cepat = puas, lambat = kecewa
โ‘ข Consistency Konsistensi kinerja dari waktu ke waktu Selalu on-time, tidak pernah stockout Very High: trust & loyalty builder
โ‘ฃ Flexibility Kemampuan handle situasi darurat Rush order, order change, return Medium: critical saat emergency
โ‘ค Malfunction Handling Cara handle masalah (komplain, return) Easy return, quick replacement Very High: make or break loyalty
โ‘ฅ Information Ketersediaan informasi order & tracking Real-time tracking, proactive notification High: reduce anxiety, build trust
โ‘ฆ Post-Sale Support Dukungan setelah pembelian Warranty, technical support, installation Medium: important for complex products

๐Ÿ“Š Service Quality Gap Model:

5 Gaps yang Bisa Terjadi:

Gap 1: Tidak paham ekspektasi customer (research kurang)
Gap 2: Paham tapi tidak design service yang tepat (strategy salah)
Gap 3: Design bagus tapi tidak deliver sesuai standar (execution buruk)
Gap 4: Deliver bagus tapi over-promise di marketing (komunikasi salah)
Gap 5: Expected service โ‰  Perceived service (customer kecewa)

๐Ÿ‡ฎ๐Ÿ‡ฉ Contoh Indonesia: Service Excellence PT Blue Bird Group

Konteks: Blue Bird sebagai taksi premium harus deliver service excellence di setiap elemen.

Service Elements Implementation:

  • Availability: 25,000+ armada, 95% bisa dapat taksi dalam 5 menit di area coverage
  • Order Cycle: Average pickup time 3-7 menit via app
  • Consistency: 98% on-time pickup, driver rating 4.7/5
  • Flexibility: Bisa booking ahead, change destination, multiple stops
  • Malfunction Handling: 24/7 call center, refund otomatis jika ada masalah
  • Information: Real-time tracking, driver info, ETA, fare estimate
  • Post-Sale Support: Lost & found service, complaint handling dalam 24 jam

Business Impact:

  • Customer satisfaction: 4.6/5 (vs Gojek 4.3/5, Grab 4.2/5)
  • Repeat customer rate: 85%
  • Market share: 40% di segmen premium taxi
  • Revenue growth: 15% per tahun
๐Ÿ’ก Prinsip Service Elements: “Customers don’t just buy products, they buy the total experience.” Service elements seringkali lebih penting daripada produk itu sendiri dalam membangun loyalitas. Perusahaan yang unggul di service elements bisa charge premium price dan retain customer lebih lama.
๐ŸŽฏ

3. Customer Segmentation: One Size Does NOT Fit All

โ–ผ

Tidak semua pelanggan sama. Customer segmentation memungkinkan perusahaan untuk allocate resources secara efisien dan deliver service yang tepat untuk setiap segmen.

๐ŸŽฏ 4 Basis Customer Segmentation:

Basis Kriteria Contoh Segmen Service Strategy
โ‘  Demographic Usia, gender, income, pendidikan โ€ข Millennials (25-40)
โ€ข Gen Z (18-25)
โ€ข High-income
Tailored product & communication
โ‘ก Behavioral Purchase frequency, loyalty, usage โ€ข Heavy users
โ€ข Occasional buyers
โ€ข Price-sensitive
Loyalty program, personalized offers
โ‘ข Geographic Lokasi, urban/rural, climate โ€ข Jabodetabek
โ€ข Luar Jawa
โ€ข Rural areas
Different delivery options & lead time
โ‘ฃ Psychographic Lifestyle, values, personality โ€ข Eco-conscious
โ€ข Convenience-seekers
โ€ข Status-seekers
Sustainable options, premium service

๐Ÿ“Š Pareto Principle (80/20 Rule) dalam Customer Segmentation:

Segmen % dari Customer % dari Revenue % dari Profit Service Level
A (VIP) 5% 35% 50% Premium, white-glove
B (Regular) 15% 35% 30% Standard, responsive
C (Occasional) 30% 25% 15% Basic, efficient
D (Low-value) 50% 5% 5% Self-service, automated

๐Ÿ‡ฎ๐Ÿ‡ฉ Contoh Indonesia: Customer Segmentation PT BCA

Konteks: BCA sebagai bank terbesar di Indonesia memiliki 100+ juta nasabah dengan berbagai segmen.

Customer Segmentation:

  • Prioritas (VIP): Nasabah dengan saldo > Rp 1 miliar โ†’ dedicated relationship manager, priority lane, lounge access, concierge service
  • Solusi (Regular): Nasabah dengan saldo Rp 50-1000 juta โ†’ priority service, dedicated call center, special offers
  • Blue (Mass): Nasabah dengan saldo < Rp 50 juta โ†’ self-service, digital banking, standard service
  • Business: UMKM & korporasi โ†’ dedicated business banker, customized solutions

Service Differentiation:

Service Element Prioritas (VIP) Solusi (Regular) Blue (Mass)
Branch Service Priority lane, VIP room Priority lane Regular queue
Call Center Dedicated line, < 30 sec Priority queue, < 2 min Regular queue, < 5 min
ATM Withdrawal Free, all ATMs Free, BCA ATMs Free, 10x/bulan
Relationship Manager Dedicated RM Shared RM No RM
Special Offers Exclusive invites Special rates Standard promo

Business Impact:

  • VIP customer retention: 98%
  • Revenue per VIP customer: 10x vs mass customer
  • Cost to serve: optimized (mass customer via digital, VIP via human)
  • Customer satisfaction: 4.7/5 (highest in Indonesian banking)
โš ๏ธ Common Mistake: Banyak perusahaan treat semua customer sama โ†’ over-serve low-value customer (cost tinggi) dan under-serve high-value customer (lost revenue). Solusi: segmentasi yang jelas dan differentiated service level.

๐Ÿ›’ PART B: Omni-Channel Distribution Strategy

Dari single-channel ke omni-channel: seamless customer experience di semua touchpoints

๐Ÿ”„

1. Evolusi Channel: Single โ†’ Multi โ†’ Omni (Chopra Ch 4)

โ–ผ
Definisi: Omni-channel distribution adalah pendekatan terintegrasi yang memberikan pengalaman pelanggan yang seamless dan konsisten di semua channel (online, offline, mobile, social), dengan data dan inventory yang terkoneksi real-time.

๐ŸŽฏ Evolusi Channel Distribution:

Era Karakteristik Contoh Kelemahan
Single-Channel
(Pre-2000)
Satu channel saja (toko fisik atau katalog) Toko tradisional, mail-order catalog Limited reach, no flexibility
Multi-Channel
(2000-2015)
Beberapa channel, tapi tidak terintegrasi Toko fisik + website + call center (masing-masing separate) Siloed operations, inconsistent experience
Cross-Channel
(2015-2020)
Beberapa channel dengan beberapa integrasi Buy online pick up in store (BOPIS), return online to store Partial integration, some friction points
Omni-Channel
(2020+)
Semua channel fully integrated, seamless experience Unified inventory, single customer view, consistent pricing Complex to implement, high investment

๐Ÿ“Š Multi-Channel vs Omni-Channel:

Aspek Multi-Channel Omni-Channel
Channel Integration Low โ€“ each channel operates independently High โ€“ all channels fully integrated
Customer View Fragmented โ€“ different data per channel Unified โ€“ single customer view across all channels
Inventory Siloed โ€“ separate inventory per channel Unified โ€“ one inventory pool, visible to all channels
Pricing May vary by channel Consistent across all channels
Customer Experience Inconsistent โ€“ different experience per channel Seamless โ€“ consistent experience, can switch channels anytime
Technology Separate systems per channel Integrated platform (ERP, OMS, WMS, CRM)
Example Department store with separate e-commerce Uniqlo: buy online, return in store, check inventory in real-time

๐Ÿ‡ฎ๐Ÿ‡ฉ Contoh Indonesia: Omni-Channel PT Matahari Department Store

Konteks: Matahari transformasi dari multi-channel ke omni-channel untuk compete dengan e-commerce pure player.

Omni-Channel Implementation:

  • Unified Inventory: Semua inventory (150+ toko + warehouse) visible di satu sistem
  • Single Customer View: Customer data terintegrasi dari toko, website, app, social media
  • Endless Aisle: Customer bisa order produk yang tidak ada di toko, kirim ke rumah
  • BOPIS (Buy Online Pick Up In Store): Order di app, pickup di toko dalam 2 jam
  • BORIS (Buy Online Return In Store): Return barang online di toko fisik
  • Click & Collect: Order online, collect at store with special counter

Technology Stack:

  • ERP: SAP for inventory & finance
  • OMS (Order Management System): for order routing & fulfillment
  • WMS (Warehouse Management System): for warehouse operations
  • CRM: for customer data & loyalty program
  • Mobile App: for customer engagement & ordering

Business Impact (2020-2024):

  • Online sales: 15% โ†’ 35% of total revenue
  • BOPIS adoption: 25% of online orders
  • Customer retention: 70% โ†’ 85%
  • Average order value: +20% (omni-channel customers spend more)
  • Inventory turnover: 6x โ†’ 9x/year
  • Cost to serve: -15% (efficiency from unified operations)
๐Ÿ’ก Prinsip Omni-Channel: “Omni-channel is not about having many channels, it’s about making them work together seamlessly.” Customer tidak peduli berapa banyak channel yang Anda punya, yang penting mereka bisa switch antar channel tanpa friction.
๐Ÿ“ฆ

2. Omni-Channel Fulfillment Options (Chopra Ch 4)

โ–ผ

Omni-channel memerlukan flexible fulfillment options untuk accommodate berbagai preferensi customer.

๐ŸŽฏ 6 Omni-Channel Fulfillment Models:

Model Deskripsi Keuntungan Kapan Digunakan
โ‘  Ship from DC
(Traditional)
Kirim dari distribution center/warehouse โ€ข Economies of scale
โ€ข Centralized inventory
โ€ข Lower cost
Standard delivery, non-urgent orders, high-volume items
โ‘ก Ship from Store
(SFS)
Kirim dari toko fisik terdekat dengan customer โ€ข Faster delivery
โ€ข Lower last-mile cost
โ€ข Better inventory utilization
Same-day/next-day delivery, urban areas, store has stock
โ‘ข Buy Online Pick Up In Store
(BOPIS)
Customer order online, pickup di toko โ€ข No shipping cost
โ€ข Immediate availability
โ€ข Drive foot traffic to store
Customer wants it now, wants to save shipping, lives near store
โ‘ฃ Buy Online Return In Store
(BORIS)
Customer return barang online di toko fisik โ€ข Convenient for customer
โ€ข Lower return shipping cost
โ€ข Opportunity for exchange
Customer wants quick refund, wants to exchange, lives near store
โ‘ค Reserve Online Pick Up In Store
(ROPIS)
Customer reserve online, bayar di toko โ€ข Guarantee availability
โ€ข No shipping cost
โ€ข Customer can try before buy
High-value items, customer wants to try, unsure about size/color
โ‘ฅ Drop Ship
(Vendor Direct)
Supplier kirim langsung ke customer โ€ข No inventory holding
โ€ข Wide assortment
โ€ข Low capital requirement
Low-volume items, bulky items, custom products, marketplace model

๐Ÿ“Š Fulfillment Model Selection Framework:

Factor Ship from DC Ship from Store BOPIS
Delivery Speed 2-5 days Same-day/Next-day 2-4 hours
Cost per Order Rp 15-30K Rp 10-20K Rp 5-10K
Inventory Requirement Centralized Distributed Distributed
Technology Need Low Medium High
Store Involvement None High High
Best For Rural areas, standard delivery Urban areas, urgent orders Customers near store, cost-sensitive

๐Ÿ‡ฎ๐Ÿ‡ฉ Contoh Indonesia: Omni-Channel Fulfillment PT MAP (Matahari, SOGO, Foot Locker)

Konteks: MAP mengelola 700+ toko retail dengan berbagai brand di Indonesia.

Fulfillment Strategy:

  • Ship from DC (60% of orders): Central warehouse di Jakarta, serve seluruh Indonesia
  • Ship from Store (25% of orders): 100+ toko di kota besar bisa fulfill online orders
  • BOPIS (10% of orders): Customer order di app, pickup di toko dalam 2 jam
  • Drop Ship (5% of orders): Untuk produk yang tidak di-stock (furniture, custom items)

Technology Enabler:

  • OMS (Order Management System): Route order ke fulfillment point optimal berdasarkan lokasi customer, inventory availability, dan cost
  • Real-time Inventory: Semua inventory visible di satu platform
  • Mobile App for Store Staff: Store staff bisa lihat online orders, pick & pack, arrange delivery
  • Customer App: Track order, choose fulfillment option, get notifications

Business Impact:

  • Order fulfillment time: 3 days โ†’ 1.5 days (50% faster)
  • Delivery cost: -20% (more orders fulfilled from store, closer to customer)
  • Inventory turnover: 8x โ†’ 12x/year (better utilization of store inventory)
  • Stockout rate: 8% โ†’ 3% (unified inventory visibility)
  • Customer satisfaction: 4.3/5 โ†’ 4.7/5
โš ๏ธ Implementation Challenges:
  • Inventory accuracy: Store inventory sering tidak akurat (shrinkage, misplacement) โ†’ customer order tapi barang tidak ada
  • Store staff training: Store staff tidak terbiasa fulfill online orders โ†’ slow, errors
  • Technology integration: Legacy systems sulit di-integrate โ†’ need significant IT investment
  • Cannibalization: Online sales might cannibalize store sales โ†’ need clear strategy
  • Solusi: Start with pilot (10-20 stores), learn, then scale up. Invest in training & technology.
๐Ÿ›ต

3. Last-Mile Delivery: The Most Critical & Costly

โ–ผ

Last-mile delivery adalah tahap terakhir dalam pengiriman barang dari fulfillment center ke tangan customer. Ini adalah most critical (customer experience) dan most costly (up to 50% of total shipping cost).

๐ŸŽฏ 5 Last-Mile Delivery Models:

Model Deskripsi Keuntungan Contoh
โ‘  Home Delivery Kirim langsung ke alamat rumah customer โ€ข Convenient for customer
โ€ข No pickup needed
JNE, J&T, SiCepat, GoSend, GrabExpress
โ‘ก Locker Pickup Kirim ke smart locker, customer ambil dengan kode โ€ข No need to be home
โ€ข Lower cost vs home delivery
โ€ข 24/7 availability
PopBox (Indonesia), Amazon Locker
โ‘ข Store Pickup Customer ambil di toko/retail location โ€ข Lowest cost
โ€ข Immediate availability
โ€ข Drive foot traffic
Indomaret, Alfamart, Alfamidi as pickup points
โ‘ฃ Crowdshipping Gunakan gig workers (ojol) untuk delivery โ€ข Flexible capacity
โ€ข Fast delivery
โ€ข Low fixed cost
Gojek, Grab, Lalamove
โ‘ค Drone/Robot Autonomous delivery menggunakan drone/robot โ€ข Very fast
โ€ข Low labor cost
โ€ข Futuristic
Still pilot in Indonesia, used in USA/China

๐Ÿ’ฐ Last-Mile Cost Breakdown:

Cost Component % of Total Last-Mile Cost Penjelasan
Labor (Driver) 40-50% Gaji driver, insentif, bonus
Vehicle 20-25% Depresiasi, maintenance, fuel
Technology 10-15% Route optimization, tracking, app
Failed Delivery 10-15% Customer tidak ada di rumah, alamat salah
Returns 5-10% Biaya reverse logistics

๐Ÿ‡ฎ๐Ÿ‡ฉ Contoh Indonesia: Last-Mile Innovation PT GoTo (Gojek-Tokopedia)

Konteks: GoTo melakukan 5+ juta delivery per hari di Indonesia.

Last-Mile Strategy:

  • Crowdshipping: 2+ juta driver Gojek sebagai delivery fleet
  • Dynamic Routing: AI-powered route optimization, real-time traffic consideration
  • Multi-Stop Routing: Driver bisa handle 5-10 orders dalam satu trip
  • GoPoints & Locker: Customer bisa pilih pickup di GoPoints (minimarket) atau smart locker
  • GoBox: Untuk barang besar, gunakan GoBox (truk kecil)

Technology Stack:

  • AI Route Optimization: Machine learning untuk optimize route, consider traffic, weather, driver location
  • Real-time Tracking: GPS tracking untuk customer & ops team
  • Dynamic Pricing: Harga menyesuaikan demand-supply (surge pricing)
  • Driver App: Navigation, order management, earnings tracking
  • Customer App: Order placement, real-time tracking, rating

Business Impact:

  • Average delivery time: 45 menit (urban), 2-3 jam (suburban)
  • Delivery success rate: 97% (first attempt)
  • Cost per delivery: Rp 8-15K (vs traditional courier Rp 20-30K)
  • Driver productivity: 15-20 deliveries/day
  • Customer satisfaction: 4.5/5
๐Ÿ’ก Prinsip Last-Mile: “Last-mile is not just about delivery, it’s about customer experience.” The moment customer receives the package is the most memorable moment. Make it count: fast, on-time, in good condition, with a smile (or friendly driver).

๐Ÿค– PART C: AI Persona Simulation โ€“ Test Your Distribution Strategy

Menggunakan AI untuk berperan sebagai pelanggan dan menguji strategi distribusi Anda

๐ŸŽญ

1. Mengapa AI Persona Simulation?

โ–ผ

AI persona simulation memungkinkan Anda untuk test distribution strategy dengan berbagai tipe pelanggan secara virtual, tanpa perlu recruit real customers.

๐Ÿš€ 5 Keunggulan AI Persona Simulation:

Keunggulan Penjelasan Contoh Aplikasi
Speed Simulasi 100+ persona dalam hitungan menit Test distribution strategy dengan berbagai segmen customer
Cost Tanpa perlu recruit & compensate real customers Save Rp 50-100 juta untuk customer research
Scalability Bisa test unlimited scenarios Test different pricing, delivery options, service levels
Consistency Persona behave consistently, no random variation Compare results across different strategies
Insight Generation AI bisa explain why persona behave certain way Understand customer motivations & pain points

๐Ÿ‡ฎ๐Ÿ‡ฉ Contoh: AI Persona Simulation untuk E-Commerce Strategy

Skenario: Perusahaan ingin launch new delivery options dan ingin test customer response.

Traditional Approach:

  • Recruit 50 customers untuk focus group discussion
  • Conduct 2-hour session dengan moderator
  • Analyze transcripts & generate insights
  • Time: 4-6 weeks, Cost: Rp 100 juta

AI Persona Simulation Approach:

  • Create 10 personas berdasarkan customer segments
  • Simulate 100 interactions per persona dengan different delivery options
  • Analyze AI responses & generate insights
  • Time: 2 hours, Cost: $20 (ChatGPT subscription)

Result: 95% time saving, 99% cost reduction, comparable insights quality.

๐Ÿ› ๏ธ

2. Workshop: Simulasi Pelanggan dengan AI

โ–ผ

Tugas Mahasiswa: Anda adalah SCM Manager di PT Kopi Kenangan (coffee shop chain dengan 300+ outlet). Anda ingin test distribusi strategy untuk produk kopi kemasan (ready-to-drink).

Context:

  • Produk: Kopi Kenangan kemasan (RTD coffee, 250ml bottle)
  • Price: Rp 25.000/bottle
  • Target market: Urban millennials (25-40 years old)
  • Distribution channels: Own stores, modern trade (Indomaret/Alfamart), e-commerce (Tokopedia/Shopee), own website

๐ŸŽฏ Langkah 1: Create Customer Personas (10 menit)

Gunakan prompt berikut di ChatGPT/Claude:

๐Ÿ“ Prompt untuk AI:

“You are a customer research expert. I need to create 5 detailed customer personas for PT Kopi Kenangan’s ready-to-drink coffee product (250ml bottle, Rp 25,000).

Target market: Urban Indonesian millennials (25-40 years old) in Jabodetabek, Surabaya, Bandung

For each persona, provide:
1. Name, age, occupation, income level
2. Lifestyle & habits (how often they drink coffee, when, where)
3. Coffee preferences (taste, brand loyalty, price sensitivity)
4. Shopping behavior (where they buy, online vs offline, frequency)
5. Delivery preferences (speed vs cost, home delivery vs pickup)
6. Pain points with current coffee distribution
7. What would make them switch to Kopi Kenangan RTD

Make personas diverse: different income levels, different coffee consumption patterns, different shopping preferences”

๐ŸŽฏ Langkah 2: Simulate Customer Interactions (15 menit)

Setelah dapat 5 personas, gunakan prompt ini untuk simulate interactions:

๐Ÿ“ Prompt untuk AI:

“Now, I want you to role-play as [Persona Name] (one of the personas you just created). I will present different distribution scenarios, and you respond as that persona would.

Scenario 1: Same-Day Delivery
– Customer orders Kopi Kenangan RTD via website/app
– Delivery options: Same-day (Rp 15K), Next-day (Rp 8K), Store pickup (free)
– Minimum order: 6 bottles (Rp 150K)

Scenario 2: Subscription Model
– Monthly subscription: 12 bottles delivered every 2 weeks
– Price: Rp 280K/month (vs Rp 300K if buy individually)
– Free delivery, can pause/cancel anytime

Scenario 3: Bundle with Food
– Bundle: 3 bottles + 1 pastry = Rp 100K (save Rp 25K)
– Available only in-store pickup

For each scenario, respond as the persona:
1. Would you buy? Why or why not?
2. What is your main concern or hesitation?
3. What would make you more likely to buy?
4. How does this compare to your current coffee buying behavior?
5. What is the maximum you would pay for this option?”

๐ŸŽฏ Langkah 3: Analyze Results & Generate Insights (10 menit)

Setelah simulate semua personas dengan semua scenarios, gunakan prompt ini:

๐Ÿ“ Prompt untuk AI:

“Based on the persona simulations, please analyze the results and provide strategic recommendations.

Please provide:
1. Which distribution scenario is most popular across personas? Why?
2. Which persona is most likely to adopt each scenario?
3. What are the common pain points across personas?
4. What are the key barriers to adoption for each scenario?
5. Recommended distribution strategy: which scenarios to prioritize, which to defer
6. Pricing recommendations: optimal price points for each scenario
7. Marketing recommendations: how to position each scenario to different personas
8. Implementation roadmap: what to launch first, what to test, what to scale”

๐ŸŽฏ Langkah 4: Present & Debrief (5 menit)

Presentasikan hasil dalam format:

  • Customer personas summary (5 personas)
  • Scenario simulation results (acceptance rate per persona per scenario)
  • Key insights & patterns
  • Recommended distribution strategy
  • Implementation plan (3-6-12 months)
๐Ÿš€

3. Advanced: Multi-Scenario Testing with AI

โ–ผ

Untuk more advanced testing, Anda bisa simulate multiple scenarios simultaneously dan compare results.

๐ŸŽฏ Advanced Simulation Framework:

Variable Option A Option B Option C Test Objective
Delivery Speed Same-day (2-4 jam) Next-day (24 jam) 2-3 days How much customers value speed?
Delivery Cost Free (min order Rp 200K) Flat Rp 10K Variable (by distance) Price sensitivity for delivery?
Minimum Order No minimum Min 3 items Min 6 items Impact on order size & frequency?
Return Policy 7 days, no questions 14 days, with conditions 30 days, full refund How return policy affects purchase decision?
Loyalty Program Points-based (1 point = Rp 100) Tier-based (Silver/Gold/Platinum) Cashback (5-10%) Which loyalty model is most effective?
๐Ÿ“ Advanced Prompt untuk AI:

“I want to conduct a comprehensive distribution strategy test using AI persona simulation.

Product: [Your product]
Target market: [Your target market]
Personas: [5 personas you created]

Variables to test:
1. Delivery speed: Same-day vs Next-day vs 2-3 days
2. Delivery cost: Free (min order) vs Flat fee vs Variable
3. Minimum order: No min vs Min 3 vs Min 6
4. Return policy: 7 days vs 14 days vs 30 days
5. Loyalty program: Points vs Tier vs Cashback

For each combination of variables (total 3^5 = 243 combinations):
1. Simulate how each persona would respond
2. Calculate purchase probability (0-100%)
3. Calculate expected order value
4. Calculate expected order frequency

Then provide:
1. Top 5 combinations with highest purchase probability
2. Top 5 combinations with highest expected revenue
3. Trade-off analysis: which variables matter most
4. Recommended strategy: optimal combination of variables
5. Segmentation strategy: different combinations for different personas”

๐Ÿ‡ฎ๐Ÿ‡ฉ Contoh Hasil: AI Persona Simulation untuk FMCG Distribution

Product: Indomie goreng (5-pack)
Target: Urban Indonesian households
Personas: 5 personas (busy professional, young family, student, health-conscious, budget-conscious)

Simulation Results (Top 3 Combinations):

Rank Delivery Speed Delivery Cost Min Order Return Policy Loyalty Purchase Probability Expected Revenue
1 Next-day Free (min Rp 100K) Min 3 packs 7 days Points 78% Rp 150K/order
2 Same-day Flat Rp 10K No min 14 days Cashback 72% Rp 80K/order
3 2-3 days Free (min Rp 150K) Min 5 packs 7 days Tier 68% Rp 200K/order

Key Insights:

  • Delivery speed matters, but not as much as cost (next-day + free delivery > same-day + paid delivery)
  • Minimum order size is critical: no minimum leads to small orders, high minimum reduces conversion
  • Return policy less important for FMCG (low risk product)
  • Loyalty program: points-based most preferred, cashback second

Recommended Strategy:

  • Launch with Combination #1 (next-day, free delivery min Rp 100K, min 3 packs)
  • Test Combination #2 for urban areas with high delivery density
  • Use Combination #3 for suburban/rural areas with lower delivery frequency
โš ๏ธ Limitasi AI Persona Simulation:
  • Not real customers: AI personas are based on patterns, not real individuals. Always validate with real customer testing before full launch.
  • Context limitations: AI might not capture all cultural, social, or situational factors that influence real customer behavior.
  • Over-reliance risk: Don’t rely solely on AI simulation. Use it as one input among many (market research, competitor analysis, pilot testing).
  • Solusi: Use AI simulation for rapid iteration & hypothesis generation, then validate with real customer testing (A/B testing, pilot launch, focus groups).
โœ…

4. From Simulation to Implementation: Action Plan

โ–ผ

๐ŸŽฏ 6 Langkah Implementasi Distribution Strategy:

# Langkah Aktivitas Output
1 Define Objectives Tujuan bisnis: revenue growth, market share, customer satisfaction Clear objectives dengan KPIs & targets
2 Customer Research AI persona simulation + real customer research (survey, interview) Customer personas, preferences, pain points
3 Strategy Design Design distribution strategy based on research insights Distribution strategy document dengan channel mix, service levels, pricing
4 Pilot Testing Test strategy di 1-2 cities/regions, measure results Pilot results dengan lessons learned
5 Scale-Up Roll-out strategy ke seluruh market berdasarkan pilot success Full implementation dengan performance tracking
6 Continuous Optimization Monitor performance, iterate based on data & feedback Continuous improvement dengan A/B testing

๐Ÿ‡ฎ๐Ÿ‡ฉ Contoh Indonesia: Distribution Strategy Implementation PT Unilever Indonesia

Konteks: Unilever ingin improve distribution untuk produk personal care di rural areas.

Implementation Journey (2020-2024):

Step 1: Define Objectives

  • Increase rural market share from 35% to 50% in 3 years
  • Improve rural customer satisfaction from 3.8/5 to 4.5/5
  • Reduce rural distribution cost from 25% to 18% of revenue

Step 2: Customer Research

  • AI persona simulation: create 10 rural customer personas
  • Field research: interview 500 rural customers across 5 provinces
  • Key insights: rural customers value availability & price over speed

Step 3: Strategy Design

  • Channel strategy: partner with 10,000+ warung (small retailers) as distribution points
  • Service level: weekly replenishment (vs daily in urban)
  • Pricing: smaller pack sizes (sachet) for lower price point
  • Logistics: use motorbike for last-mile delivery to remote areas

Step 4: Pilot Testing

  • Pilot in 2 provinces: Central Java & South Sulawesi
  • Duration: 6 months
  • Results: market share naik 8%, customer satisfaction naik 0.5 points

Step 5: Scale-Up

  • Roll-out to 15 provinces in year 2
  • Expand to 50,000+ warung
  • Invest in mobile app for warung ordering

Step 6: Continuous Optimization

  • Monthly performance review
  • A/B testing for different pack sizes, pricing, delivery frequency
  • Quarterly customer satisfaction survey

Hasil (3 tahun):

  • Rural market share: 35% โ†’ 48% (37% increase)
  • Rural customer satisfaction: 3.8/5 โ†’ 4.4/5
  • Rural distribution cost: 25% โ†’ 19% of revenue
  • Rural revenue growth: 45% (vs 15% urban growth)
  • ROI: 280% dalam 3 tahun
๐Ÿ’ก Prinsip Implementation: “Distribution strategy is not a one-time project, but a continuous journey.” Customer preferences change, competitors evolve, technology advances. Always monitor, learn, and adapt. Use AI persona simulation for rapid iteration, but always validate with real customer data.

๐Ÿ“‹ Ringkasan Eksekutif Sesi 03

  • Customer Accommodation: 4 dimensi: time, place, quantity, assortment. Balance antara accommodation level dan cost efficiency. Tidak ada “best level”, hanya “best fit for your target customer”.
  • Service Elements: 7 elemen critical: availability, order cycle, consistency, flexibility, malfunction handling, information, post-sale support. Service quality gap model: 5 gaps yang bisa terjadi antara expected vs perceived service.
  • Customer Segmentation: 4 basis: demographic, behavioral, geographic, psychographic. Pareto principle: 20% customers = 80% revenue. Differentiated service level untuk different segments.
  • Omni-Channel Distribution: Evolusi dari single-channel โ†’ multi-channel โ†’ cross-channel โ†’ omni-channel. Omni-channel = all channels fully integrated, seamless customer experience. Key enablers: unified inventory, single customer view, integrated technology.
  • Fulfillment Options: 6 models: ship from DC, ship from store, BOPIS, BORIS, ROPIS, drop ship. Selection based on delivery speed, cost, inventory availability, customer preference.
  • Last-Mile Delivery: Most critical & costly stage (up to 50% of shipping cost). 5 models: home delivery, locker pickup, store pickup, crowdshipping, drone/robot. Technology enablers: AI route optimization, real-time tracking, dynamic pricing.
  • AI Persona Simulation: Powerful tool untuk test distribution strategy tanpa perlu real customers. 5 keunggulan: speed, cost, scalability, consistency, insight generation. Use for rapid iteration, but always validate with real customer testing.
  • Implementation: 6 steps: define objectives โ†’ customer research โ†’ strategy design โ†’ pilot testing โ†’ scale-up โ†’ continuous optimization. Use AI simulation for hypothesis generation, validate with pilot, then scale.

๐Ÿ“š Referensi

  • Bowersox, D.J., Closs, D.J., & Cooper, M.B. (2019). Supply Chain Logistics Management (5th ed.). McGraw-Hill. Chapter 3: Retail Logistics and Customer Accommodation
  • Chopra, S., & Meindl, P. (2023). Supply Chain Management: Strategy, Planning, and Operation (8th ed.). Pearson. Chapter 4: Distribution Networks in a Supply Chain
  • Brynjolfsson, E., Hu, Y., & Simester, D. (2011). Goodbye Pareto Principle, Hello Long Tail: The Effect of Search Costs on the Concentration of Product Sales. Management Science, 57(8), 1373-1386.
  • Verhoef, P.C., Kannan, P.K., & Inman, J.J. (2015). From Multi-Channel Retailing to Omni-Channel Retailing. Journal of Retailing, 91(1), 174-181.
  • Hรผbner, A., Wollenburg, J., & Lindner, A. (2016). Last Mile Fulfilment and Distribution in Omni-Channel Retailing. International Journal of Retail & Distribution Management, 44(3), 267-292.
  • AurinoWorks. (2024). Omni-Channel Distribution in Indonesian Context: Case Studies & Best Practices. Internal Research.
๐Ÿ“ฆ Materi Pelengkap / Arsip

Supply Chain Drivers & Financial Metrics

Materi berikut merupakan pelengkap pemahaman SCM secara menyeluruh. Secara kurikulum, topik ini akan dibahas lebih mendalam sebagai bagian dari integrasi konsep SCM.

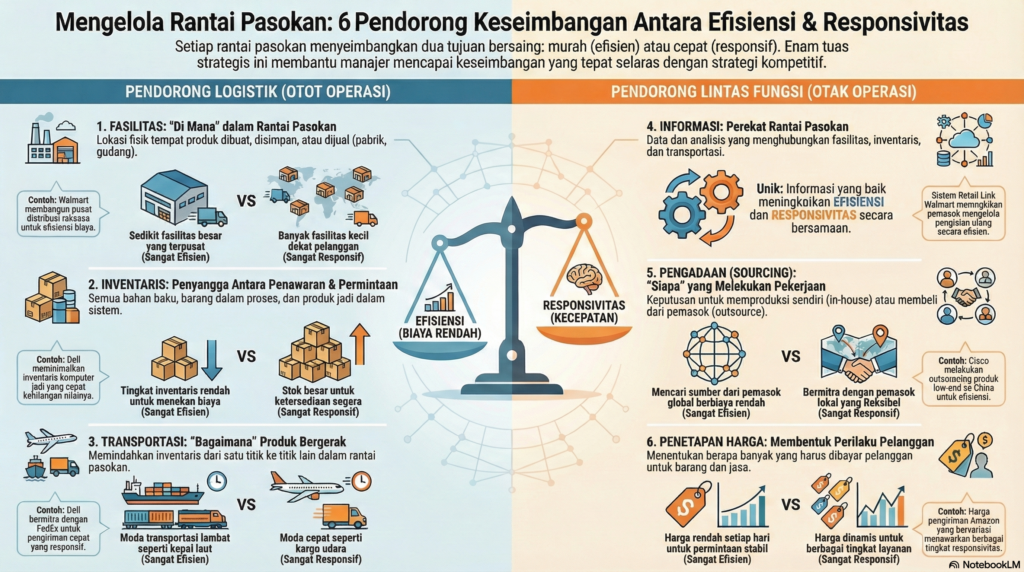
Tujuannya adalah membedah enam pendorong (drivers) utama yang membentuk arsitektur rantai pasokan dan memahami bagaimana metrik-metrik di dalamnya memungkinkan kita mengalibrasi keseimbangan antara efisiensi biaya dan responsivitas pasar demi mencapai keselarasan strategis (strategic fit) yang berkelanjutan.

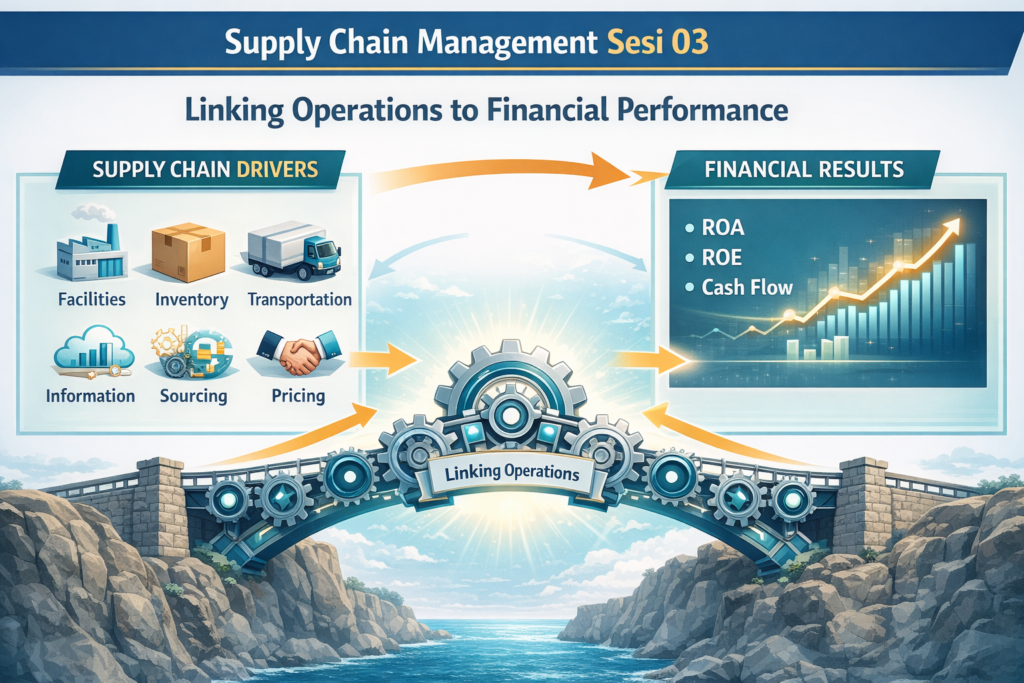
Diagram alur pendorong kinerja rantai pasok yang menghubungkan fasilitas, inventaris, dan transportasi dengan kinerja finansial perusahaan

Dari perspektif investasi, rantai pasokan adalah penggerak utama aset dan biaya. Berdasarkan kerangka kerja Chopra & Meindl, kita memantau tiga indikator finansial utama yang

  • Return on Equity (ROE): Metrik utama bagi pemegang saham yang mengukur laba bersih terhadap ekuitas. SCM berkontribusi di sini melalui peningkatan laba bersih dan optimalisasi modal kerja.
ROE=Net IncomeShare Holder EquityROE = \frac{\text{Net Income}}{\text{Share Holder Equity}}
  • Return on Assets (ROA): Mengukur efisiensi perusahaan dalam menggunakan asetnya untuk menghasilkan keuntungan. Keputusan SCM mengenai lokasi fasilitas dan tingkat inventaris menentukan seberapa produktif aset perusahaan bekerja.
ROA=Laba Sebelum BungaTotal Aset Rata-rataROA = \frac{\text{Laba Sebelum Bunga}}{\text{Total Aset Rata-rata}}
  • Siklus Kas-ke-Kas (Cash-to-Cash Cycle / C2C): Metrik likuiditas yang mengukur kecepatan perusahaan mengubah investasi bahan baku menjadi uang tunai dari pelanggan. Rantai pasokan yang unggul meminimalkan siklus ini untuk membebaskan modal kerja.
C2C=โˆ’days payable+days in inventory+days receivableC2C = -\text{days payable} + \text{days in inventory} + \text{days receivable}

linking operations to financial performance

3.0 Kerangka Kerja Strategis: 6 Pendorong (Drivers) Kinerja

Untuk menerjemahkan strategi menjadi hasil nyata, manajemen harus secara aktif mengelola enam pendorong kinerja yang dibagi menjadi pendorong fisik (Logistik) dan penggerak koordinasi (Lintas Fungsi).

3.1 Pendorong Logistik (Logistical Drivers)

Aset fisik yang menjadi tulang punggung pergerakan barang:

  1. Fasilitas (Facilities): Lokasi fisik tempat produk disimpan atau diproduksi.
    • Trade-off: Sentralisasi (efisiensi skala ekonomi) vs. Desentralisasi (responsivitas terhadap pelanggan lokal).
  2. Persediaan (Inventory): Mencakup cycle, safety, dan seasonal inventory.
    • Trade-off: Stok rendah (mengurangi biaya penyimpanan/efisien) vs. Stok tinggi (menjamin ketersediaan/responsif).
  3. Transportasi (Transportation): Arteri yang menggerakkan produk antar tahap.
    • Trade-off: Moda lambat/murah seperti kapal laut (Efisiensi) vs. Moda cepat/mahal seperti pesawat (Responsivitas).

3.2 Pendorong Lintas Fungsi (Cross-Functional Drivers)

Elemen strategis yang mengoordinasikan seluruh jaringan secara cerdas:

  1. Informasi (Information): Pendorong terbesar yang memungkinkan koordinasi data secara real-time. Ini adalah kunci untuk mengurangi variansi permintaan (Bullwhip Effect).
  2. Pengadaan (Sourcing): Keputusan strategis mengenai aktivitas mana yang dilakukan secara internal (in-house) dan mana yang dialihdayakan (outsource).
  3. Penetapan Harga (Pricing): Tuas manajerial untuk membentuk profil permintaan pelanggan agar sesuai dengan kapasitas pasokan yang tersedia.

4.0 Matriks Keputusan: Trade-Off dan Metrik Kunci

Tabel berikut merangkum bagaimana setiap pendorong dikalibrasi untuk mendukung strategi yang dipilih:

Pendorong KinerjaMetrik UtamaFokus Efisiensi (Lean)Fokus Responsivitas (Agile)
FasilitasCapacity UtilizationFasilitas besar & sedikitBanyak fasilitas kecil
PersediaanInventory TurnsRendah (Just-in-Time)Tinggi (Buffer Stock)
TransportasiCost per Unit ShippedKonsolidasi besarPengiriman kecil & sering
InformasiForecast ErrorFokus pada reduksi biayaFokus pada kecepatan data
SumberDays Payable Outst.Biaya terendahFleksibilitas & Kecepatan
Penetapan HargaProfit MarginHarga rendah & stabilHarga dinamis/premium

5.0 Aplikasi Strategis: Studi Kasus Global dan Lokal

5.1 Kasus Global: Amazon vs. Nordstrom

  • Amazon (Efisiensi Fasilitas): Menggunakan pusat distribusi raksasa yang sangat tersentralisasi. Mereka mengorbankan biaya transportasi (lebih mahal ke pelanggan akhir) demi efisiensi luar biasa pada biaya fasilitas dan inventaris melalui skala ekonomi.
  • Nordstrom (Responsivitas Inventaris): Sebagai peritel kelas atas, mereka menyimpan persediaan tinggi langsung di toko retail premium. Pelanggan mendapatkan layanan seketika, namun Nordstrom menanggung biaya inventaris dan fasilitas yang jauh lebih tinggi.

5.2 Kasus Lokal: PT Indofood CBP Sukses Makmur

  • Fasilitas Terdesentralisasi: Dengan geografi kepulauan Indonesia, Indofood membangun puluhan pabrik di wilayah strategis. Ini menekan biaya transportasi produk massal (mie instan) dan memastikan ketersediaan hingga ke tingkat warung pelosok.
  • Integrasi Vertikal (Sourcing): Memiliki pabrik tepung (Bogasari) sendiri memberikan kontrol penuh atas biaya bahan baku, krusial untuk menjaga harga tetap terjangkau (Pricing driver) bagi pasar yang sensitif harga.

6.0 Peta Jalan Implementasi Metrik

Untuk mengubah konsep ini menjadi aksi operasional, organisasi harus melakukan langkah berikut:

  1. Audit ROA: Melakukan pemetaan aset rantai pasok mana yang paling membebani neraca keuangan.
  2. Dashboard Pendorong: Menetapkan KPI spesifik untuk setiap dari 6 pendorong (misal: target Inventory Turns per kategori produk).
  3. Sinkronisasi Informasi: Memastikan strategi diskon (Pricing) terintegrasi dengan rencana pengadaan (Sourcing) untuk menghindari kehabisan stok.

Penutup Strategis:

Memahami pendorong dan metrik bukan sekadar tentang angka, melainkan tentang memahami karakter unik bisnis Anda. Tanpa metrik yang tepat, kita tidak bisa mengukur apakah strategi Strategic Fit kita benar-benar bekerja atau hanya sekadar teori di atas kertas.

Lanjutkan ke pembahasan mengenai desain jaringan distribusi di:


Referensi Utama (APA 7th Edition)

Categories: Supply Chain Management | Financial Metrics | Logistics Strategy

Leave a Comment

Your email address will not be published. Required fields are marked *